Data Dashboards

The Institutional Research, Assessment, and Planning Office provides data and information on college’s programs, enrollment, and student success. This page contains data dashboards for the college and community members. The data dashboards below are organized by Search and Overview, Guided Pathways, and Program Review.

If you are an FCC faculty, classified professional, or administrator, you may also access data dashboards by using this link to log into the Tableau Server or by logging in via the portal and using the Tableau app. 

Search and Overview

The following dashboards provide the option to search for data dashboards on this page using keywords, an overview of Fresno City College data at a glance, and our core institutional set standards that guide our planning processes.  

Search Cloud 

Search Cloud dashboard

Not sure where to start? Use this dashboard to search for data using keywords.

Info Book

Fresno City College Info Book dashboard

Preview Fresno City College data trends and recent data at a glance. 

Institutional Set Standards

Institutional Set Standards dashboard

The college's standards for student achievement include 8 core indicators. 

Program Review

The program review process promotes a self-reflective evaluation of programs so faculty, classified professionals, and administrators can identify their programmatic successes, identify improvement areas, and establish departmental goals promoting growth and student success. Program Review enhances the College’s ability to improve student learning and achievement. Reviews are considered in college-wide planning for improvement and informed decision-making. The data in the program review dashboards assist faculty in responding to the items required in the Program Review template.

Program Review -

Instructional

PR Instructional
dashboard

Program Review -

Student Services

PR Student Services dashboard

Guided Pathways

The Guided Pathways framework is an institution-wide approach to creating clear educational pathways to career or transfer, by supporting students from start to finish, and removing barriers so that all students can be successful. We apply this framework in telling our story by using data related to the student journey as they begin (Start Strong), persist (Stay Strong), and complete (Finish Strong).

Start Strong 

Start Strong dashboards are related to supporting students as they begin their journey (e.g. Enrollment).

Student Headcount and Course Enrollment Trends

Student Headcount and Course Enrollment dashboard

New Student Course Success: First Semester

New Student Course Success

Stay Strong

Stay Strong dashboards are related to supporting students as they persist in their journey (e.g. Student Success).

Course Success, Retention, and GPA Trends

Success, Retention, and GPA dashboard

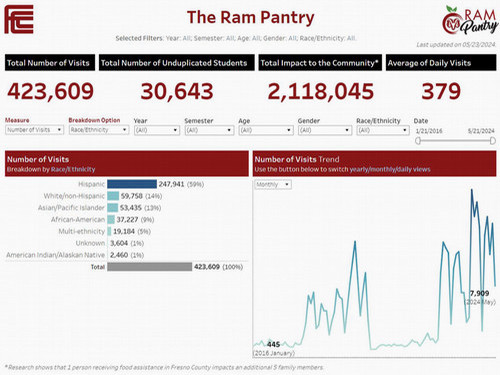
A screenshot of the Ram Pantry dashboard  showing the usage of the FCC Ram Pantry.

Success by Course: Grade Distribution

Success by Course
dashboard

A screenshot of the Ram Pantry dashboard  showing the usage of the FCC Ram Pantry.

Community College Survey of Student Engagement (CCSSE)

Community College Survey dashboard

A screenshot of the Ram Pantry dashboard  showing the usage of the FCC Ram Pantry.

Equity Plan Data Analysis

Equity Plan dashboard

Finish Strong 

Finish Strong dashboards are related to the culmination of the student journey (e.g. Degrees and Certificates).

A screenshot of the Ram Pantry dashboard  showing the usage of the FCC Ram Pantry.

Degrees and Certificates

Degrees and Certificates dashboard

A screenshot of the Ram Pantry dashboard  showing the usage of the FCC Ram Pantry.

Transfer Students

Transfer Students dashboard

A screenshot of the Ram Pantry dashboard  showing the usage of the FCC Ram Pantry.

Time to Degree

Time to Degree dashboard

Data Sources

The data dashboards on this page include snapshots of data that have been made after the submission of grades. Internally these are referred to as ATERM files. Unless otherwise specified the data source for public dashboards is ATERM. This data may slightly differ from Management Information Systems (MIS) data due to the timing difference. ATERM data is used to allow for flexibility in data disaggregation as an equity-minded practice.  

Dashboard Updates

The data dashboards on this page are updated annually at the end of the summer term. 

Have a specific data need?

To request additional data, visit the Data Requests page.

If you have any questions about the data dashboards, email us at ir@fresnocitycollege.edu